


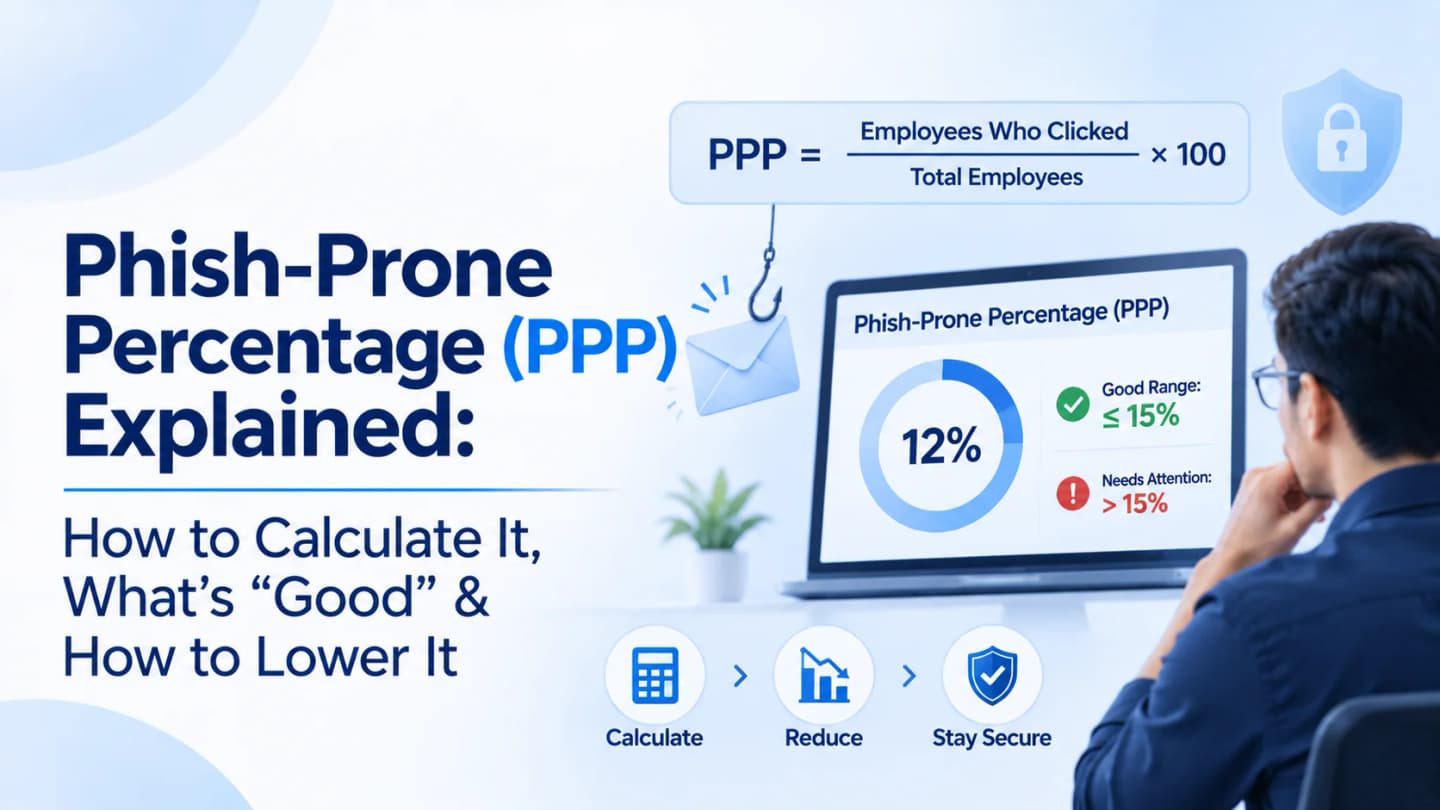
Phish-prone percentage (PPP) is the proportion of employees who perform a defined risky action, usually clicking a link, during a phishing simulation. Calculate it by dividing the number of unique employees who performed that action by the number of employees who received the simulation, then multiplying by 100. More importantly, track PPP over time rather than treating it as a one-off score.
In This Guide
Why Course Completion Is Not Risk Data
What Is Phish-Prone Percentage (PPP)?
How to Calculate PPP
What Is a Good PPP? (2026 Benchmarks)
PPP vs. Phishing Click Rate
Metrics to Report Alongside PPP
How to Interpret Results
6 Measurement Mistakes
How to Lower Your PPP
PhishTop, FAQ and Keep Reading
Formula:
PPP = (unique employees who performed the defined risky action ÷ employees who received the simulation) × 100
Why Course Completion Is Not Risk Data
Counting completed courses only tells you who clicked “next” on a slideshow. It does not tell you who might fall for a convincing invoice scam tomorrow morning.
To understand actual phishing risk, you need behavioral data: how many employees interact with a suspicious link or attempt to submit credentials during controlled tests.
What Is Phish-Prone Percentage (PPP)?
Phish-prone percentage (PPP) estimates the proportion of employees who perform a defined risky action during a simulated phishing campaign. This action might include clicking a simulated link or attempting to submit credentials.
For example, if 200 employees receive a simulation and 50 click the link, the click-based PPP is 25%.
Why it matters:
Establishes a baseline for phishing susceptibility.
Identifies departments or roles that may need additional support.
Shows whether security awareness efforts are working.
Allows you to compare campaign results over time.
Makes training more targeted and measurable.
A limitation to remember: PPP measures one specific behavior under simulated conditions. It is not a complete measure of your cybersecurity posture or the likelihood of every real-world security incident.
How to Calculate PPP
PPP = (unique employees who performed the defined risky action ÷ employees who received the simulation) × 100
The numerator and denominator must cover the same scope. If you are measuring link clicks, count the employees who clicked. If you are measuring credential-submission attempts, count those instead. Never combine different actions without clearly defining the measurement method.
Worked Example: One Campaign
Result | Employees |
|---|---|
Received the email | 200 |
Clicked the simulated link | 50 |
Reported the email | 90 |
Did not interact | 60 |
PPP = (50 ÷ 200) × 100 = 25%
The remaining 75% did not click. However, that does not necessarily mean all of them recognized the email as suspicious. Some may simply have ignored it.
Worked Example: Measuring Improvement
Measure | Campaign 1 | Campaign 2 |
|---|---|---|
Received | 200 | 200 |
Clicked | 50 | 30 |
PPP | 25% | 15% |
Improvement: 25% − 15% = 10 percentage points, representing a 40% relative reduction ((10 ÷ 25) × 100).
Pro tip: Count unique employees, not total clicks. If one person clicks the same link three times, that still counts as one person in the numerator.
What Is a Good PPP?
There is no universal threshold that guarantees safety. A lower PPP generally indicates that fewer employees performed the measured action. However, the result must be interpreted in context, including industry, organization size, employee roles, scenario difficulty, previous training, simulation frequency, email filtering and measurement methodology.
What Industry Benchmarks Show
KnowBe4's 2026 Phishing by Industry Benchmarking Report, published July 7, 2026, analyzed simulated phishing tests worldwide and reported the following global average PPP figures:
Stage | Global average PPP | Change vs. baseline |
|---|---|---|
Before security awareness training | 33.2% | n/a |
After 90 days of training | 20.1% | −40% |
After 12 months of continuous testing and training | 4.2% | −87% |
After 24 months | 3.9% | Stabilizes |
The same report identified regional differences. Africa recorded the highest baseline PPP at 35.9%, as well as the highest residual risk after one year at 7.4%. It also highlights that the 90-day mark is not the finish line.
These are one vendor's research population and methodology, so treat them as context, not as your target. Set your own baseline and compare using consistent definitions. A good PPP is not just a low number; it is a number that keeps improving alongside real behavior change.
A good PPP is not simply a low number. It is a number that continues to improve alongside meaningful behavioral change.
PPP vs. Phishing Click Rate
These metrics are related, but they are not always identical. The difference depends on how each is defined and calculated.
Metric | What it measures |
|---|---|
PPP | % of employees who perform a defined risky action in a simulation |
Click rate | % of delivered simulation emails associated with a link click, according to the campaign's calculation method |
Example: Suppose 500 emails are sent to 500 employees. A total of 100 employees click, and 20 of them click more than once.
When counting unique employees, the click-based PPP is 20%. When counting every click event, the result will be higher.
Document four things in every report:
Whether the denominator represents delivered emails or unique recipients.
Whether the numerator counts unique employees or total interactions.
Which action is considered risky.
Whether repeated interactions are counted separately.
Metrics to Report Alongside PPP
Metric | What it shows |
|---|---|
Phishing reporting rate | % of employees who report the simulated email through the official channel. A higher rate generally indicates a stronger reporting culture. |
Credential-submission attempt rate | % of employees who attempted to submit data through the simulated form (never collect real passwords). |
Time to report | How fast the SOC learns about a threat |
Repeat interaction rate | Who repeats risky actions across campaigns and may need targeted help |
Training completion rate | Admin progress, not proof of learning |
Assessment performance | Indicates whether knowledge is improving, rather than simply showing course completion. |
Why One Metric Is Not Enough
Department A | Department B | |
|---|---|---|
PPP | 18% | 18% |
Reporting rate | 65% | 25% |
Training completion | 95% | 70% |
Both departments have the same PPP, but their needs are very different. Department B needs additional support with phishing reporting and training participation.
How to Interpret Your Results
Compare results over time. One campaign provides only a snapshot. Track results across multiple campaigns using consistent definitions.
Break results down by department. For example:
Finance: 30% (15 of 50)
HR: 20%
IT: 10%
Operations: 24%
Finance's higher figure may reflect greater exposure to invoice and payment-related communications, rather than carelessness. Use this information to provide more relevant support.
Account for scenario difficulty. A poorly spelled email is very different from a polished workplace notice. The NIST Phish Scale evaluates how difficult a simulated email is for people to detect.
Consider the wider context. A high PPP may also result from a particularly difficult scenario, an unfamiliar reporting process, confusing internal communications, limited previous training or insufficient time to verify requests.
6 PPP Measurement Mistakes
Mistake | Why it misleads |
|---|---|
Treating PPP as a complete security score | Email security, identity, endpoint protection, access controls and incident response also influence an organization's exposure. |
Counting multiple clicks as multiple employees | Inflates the numerator. |
Comparing different scenarios without context | Easy-to-detect and realistic emails produce different results. |
Focusing only on clicks | Overlooks reporting, credential submissions, repeated interactions and reporting speed. |
Using PPP to blame people | Discourages employees from reporting real incidents. |
Running one simulation and stopping | A single campaign cannot demonstrate lasting behavioral change. |
How to Lower Your PPP: 7 Steps
Establish a baseline. Record the scenario, audience, measurement definition and results.
Identify risk patterns. Analyze results by department, role and campaign type.
Provide relevant training. Focus on payment fraud for Finance, fake CVs for HR, credential theft and support impersonation for IT, and executive impersonation and BEC for management.
Run regular simulations. Vary scenarios and difficulty levels. See How to Run a Phishing Test on Employees.
Improve reporting and verification. Establish one clear reporting channel and a verification rule for sensitive requests.
Strengthen technical defenses. Implement MFA, email authentication and filtering, EDR, least-privilege access and incident response.
Measure, review and improve. NIST SP 800-50 Rev. 1 supports a lifecycle approach to learning programs.
How PhishTop Helps Measure Phishing Risk
Managing phishing simulations through spreadsheets becomes increasingly difficult as an organization grows.
PhishTop supports controlled simulations, campaign analytics, employee reporting, targeted awareness and comparisons across campaigns. This helps turn PPP into a measurable trend rather than a one-off number.
Its purpose is to identify gaps and improve security awareness, not to catch employees out.
Want to track PPP and reporting-rate trends in one view? Explore PhishTop.
Frequently Asked Questions
What does PPP mean?
Phish-prone percentage: the proportion of employees who perform a defined risky action during a simulated phishing campaign.
How do I calculate it?
Divide the number of unique employees who performed the defined action by the number of employees who received the simulation, then multiply by 100.
What is a good PPP?
There is no universal score that guarantees protection. Establish your own baseline and monitor the trend. KnowBe4's 2026 report shows the global average falling from 33.2% to 4.2% after one year of continuous training.
PPP vs. click rate?
In a click-based campaign, the two metrics can be identical. However, they are not interchangeable because their definitions and calculation methods may differ.
How often should we run simulations?
Run them regularly rather than just once a year. The appropriate frequency depends on your organization's risk, workforce size and objectives.
Does a low PPP mean we are safe?
No. PPP reflects only the behavior measured in a simulation. Real attackers use other techniques and communication channels.
Keep Reading
Guide | Why |
|---|---|
The pillar overview | |
Generate your PPP data | |
Go beyond phishing metrics |
Sources: KnowBe4, 2026 Phishing by Industry Benchmarking Report findings · NIST Phish Scale · NIST SP 800-50 Rev. 1